China overtakes the US: your questions answered
1. I’ve never heard of the International Comparison Programme. What is it?
The ICP is a loose coalition of the world’s leading statistical agencies, hosted by the World Bank in Washington. Eurostat and the Organisation for Economic Cooperation and Development produce the data for advanced countries and a series of regional offices, usually national statistical agencies, provide the equivalent data for the rest of the world. In total 199 countries are covered. The results are therefore much more comprehensive than any other comparable study.
2. What is PPP?
Purchasing power parity is a measure of what money can buy. When converting national economic measures, such as gross domestic product into a common currency for comparisons, it is the correct exchange rate to use if you want to know the volume of goods and services that money buys in any economy.
This matters particularly for non-tradeable services. A basic Chinese haircut is cheaper than a basic US haircut, but because US people cannot up sticks to provincial China, there is no pressure on market exchange rates to equalise these two prices.
3. Should we trust the ICP figures?
There is no doubt that the revised methodology in calculating PPPs has made China and other Asian economies appear bigger than we previously thought. This will raise questions over the accuracy of the data, particularly as the Chinese authorities did not participate in the study.
The ICP produces new estimates of PPPs periodically. Before these latest 2011 numbers, the previous rounds were for 2005, 1993 and then further back to 1985, 1980, 1975, 1973 and 1970.
Those in the US who might like to disown the new figures should ask themselves why they accepted the 2005 ICP report, which cut 40 per cent from the size of the Chinese economy and therefore brought down the measured rate of global growth.
4. How does the calculation work that China overtakes the US?
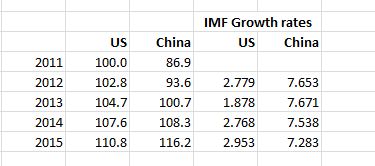
Very simply, we have taken the ICP estimate that China’s economy was 86.9 per cent of the size of the US in 2011 and applied the International Monetary Fund’s latest growth rates to the figures for 2012, 2013, 2014 and 2015 from its most recentWorld Economic Outlook. The calculations are in the screen grab below. They show that if PPPs stay constant (a usual assumption) and growth rates match the IMF projections, China will edge ahead this year and storm far ahead next year.
5. Is GDP the right measure?
It is a measure of the productive output of each economy, but it is certainly not perfect. The ICP report produced many other measures and those that are more focused on consumption give the high income countries a larger share of the global total. This reflects the larger share of household consumption in advanced economies than in poorer countries. Here is the most relevant chart.

6. What about living standards?
Clearly, economic size is far from everything. Because China has 1.3bn people compared with the 300m or so in the US, living standards in the US, Japan and most of Europe still far exceed those in China and India. This chart from the report says it all

7. Where is it expensive to live?
Generally in rich countries, you have to pay more for services wages keep up with the overall productivity levels of a nation. This is known as the Balassa Samuelson effect. The correlations are not perfect, but they are good as the following chart from the report shows.

8. So where does this leave the global league tables?
For the US and China, our best effort in producing a long run time series on the new PPPs is this.

And for the top 12 economies, here is the ICP’s estimate of how their economies relate to the US in 2011 and the previous results from 2005.


 留言列表
留言列表
